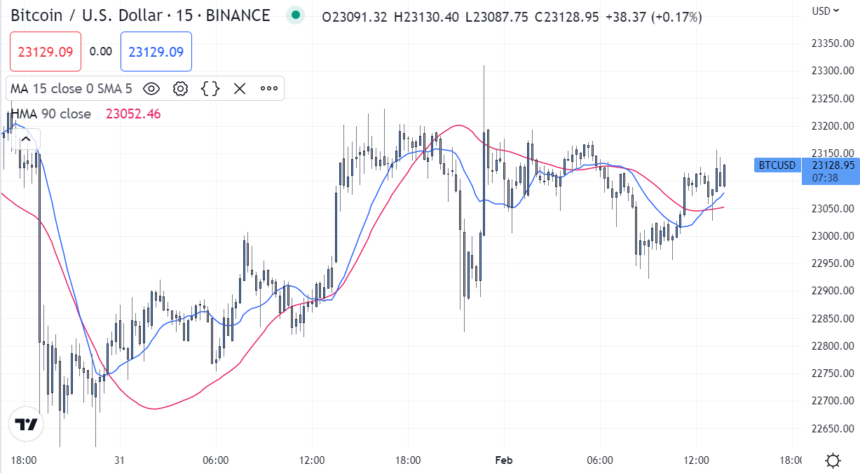
Moving averages (MAs) are a popular stock indicator used in technical analysis. They help smooth out stock price data by creating an average price that’s constantly updated. This is done to mitigate the impacts of short-term fluctuations on the stock’s price.
MAs are calculated to identify the trend direction of a stock or to determine its support and resistance levels. It’s a lagging, or trend-following, indicator because it’s based on past prices. Generally, the longer the period of the MA, the greater the lag. For example, a 200-day MA will have a greater degree of lag than a 20-day MA.
Investors and traders usually pay attention to the 50-day and 200-day MA figures. These are considered to be important trading signals. Investors may choose different periods of varying lengths to calculate MAs based on their trading objectives. Shorter MAs are typically used for short-term trading, while longer-term MAs are more suited for long-term investors.
A rising MA indicates that the security is in an uptrend, while a declining MA indicates that it is in a downtrend. Upward momentum is confirmed with a bullish crossover, which occurs when a short-term MA crosses above a longer-term MA. Conversely, downward momentum is confirmed with a bearish crossover, which occurs when a short-term MA crosses below a longer-term MA.
Using technical analysis and research can help investors make better predictions, but it’s impossible to predict the future movement of a specific stock. That’s why MAs are such an important tool in helping investors make informed decisions.
Types of Moving Averages
Simple Moving Average
The Simple Moving Average (SMA) is a popular technical indicator used by traders to measure the average price of a security over a given period of time. It is calculated by taking the average of a security’s closing prices over a set period of time. The SMA is a useful tool
Exponential Moving Average
An Exponential Moving Average (EMA) is a technical indicator that is used to measure the average of a security’s price over a set period of time. Essentially, it’s a weighted moving average that applies more weight to recent prices to give a more accurate calculation of a security’s
EMAt=[Vt×(1+ds)]+EMAy×[1−(1+ds)]
where:EMAt=EMA today
Vt=Value today
EMAy=EMA yesterday
s=Smoothing
d=Number of days
Weighted Moving Average
A Weighted Moving Average (WMA) is a type of moving average that assigns different weights to each data point in the data set. It gives more importance to recent data points and less importance to older data points. This can be useful in financial analysis, as it can be used to identify trends
Hull Moving Average
The Hull Moving Average (HMA) is a technical analysis indicator created by Alan Hull. The HMA is a faster version of the Moving Average, which is used to identify trends in the markets and generate smoother signals than the traditional Moving Average. The HMA eliminates the lag associated with conventional Moving A
Smoothed Moving Average
The Smoothed Moving Average (SMA) is a technical analysis tool used to help smooth out price action by eliminating the noise and randomness associated with standard price charts. It is similar to a simple moving average, but the SMA places more weight on the most recent data points, thus creating
What Does a Moving Average Indicate?
A moving average is a technical analysis tool used to smooth out short-term fluctuations in order to identify underlying trends and patterns. It does this by taking the average of a fixed number of previous data points, creating a continuously updated average value. This average can indicate an overall market direction, as well as help identify support and resistance levels. It also provides insight into potential changes in momentum. Moving averages provide a visual representation of the overall trend of security, helping to identify potential buy or sell opportunities.
Example of a Moving Average
The moving average is a method used to analyze data points by creating a series of averages of different subsets of the full data set. Depending on the type of moving average used, the calculation of the average will differ. For example, a simple moving average (SMA) takes the average of the closing prices over a specified number of days. For instance, in the example above, a 10-day SMA would take the average of the closing prices for the first 10 days and use that as the first data point. The next data point would drop the earliest price, add the price on day 11, and take the average of the resulting 10 prices.
What Is MACD?
The moving average convergence divergence (MACD) is a popular tool used by traders to track the correlation between two moving averages, calculated by subtracting a 26-day exponential moving average from a 12-day exponential moving average. This tool also utilizes a signal line, a nine-day exponential moving average of the MACD line and plotted on the same graph. The signal line is used to help identify changes in the trend and to affirm the strength of the trend. When the MACD is positive, it means that the short-term average is higher than the long-term average, indicating an upward momentum. Conversely, when the short-term average is lower than the long-term average, it is a sign of downward momentum.


